Ethereum Is In A Range And Struggling Below The High Of $1,880

Ethereum price (ETH) has remained trapped between the moving average lines.
Long-term analysis of the Ethereum price: bearish
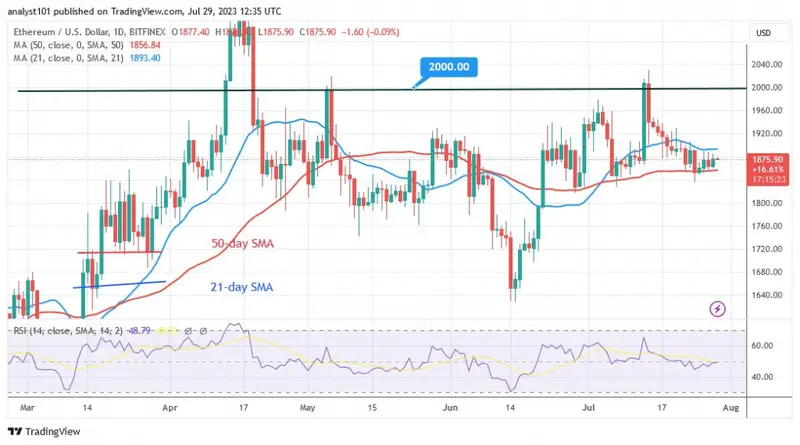
The moving average lines have not been broken by either the bulls or the bears. If the moving average lines are broken, the largest altcoin will trend. According to the price indicator, the altcoin will fall above $1,800 and then resume its uptrend.
In other words, if the resistance at $1,920 and the 21-day line of SMA are broken, the largest altcoin will show a trend. Ether will rise to the psychological price threshold of $2,000 in the near future. At the time of writing, Ether is worth $1,876.10. In the meantime, the price movement between the moving average lines has remained stagnant.
Ethereum indicator analysis
Ether has declined to the Relative Strength Index of period 14, level 49. This means that Ether has reached the price level where supply and demand are balanced. The price bars are located between the moving average lines that formed the zone of the range boundary. The bullish impulses were nipped in the bud below the $1,880 level.

Technical Indicators:
Key resistance levels – $1,800 and $2,000
Key support levels – $1,600 and $1,400
What's next for Ethereum?
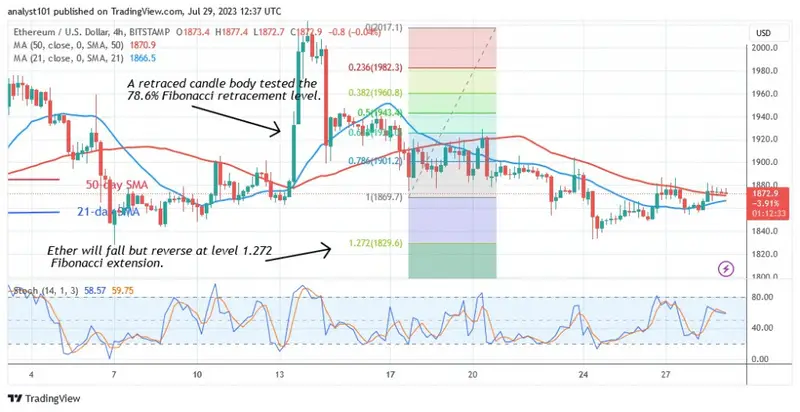
Ether is bearish but remains trapped between the moving average lines. At the bottom of the chart, Ether is expected to fall and reverse. Ether corrected higher during the July 18 bounce, and a declining candlestick tested the 78.6% Fibonacci retracement line. The correction suggests that Ether will fall but then reverse at the 1.272 Fibonacci extension or $1,829.60. The price of the cryptocurrency fell to the low of the 1.272 Fibonacci extension and then reversed.

Disclaimer. This Analysis and forecast are the personal opinions of the author and are not a recommendation to buy or sell cryptocurrency and should not be viewed as an endorsement by CoinIdol.com. Readers should do their research before investing in funds.
Comments
Post a Comment