Litecoin Threatens To Fall Further After Breaking Below The $90 Support Level

The price of Litecoin (LTC) has fallen below its moving average lines, indicating that the cryptocurrency remains under selling pressure.
Long-term forecast of Litecoin price: bearish
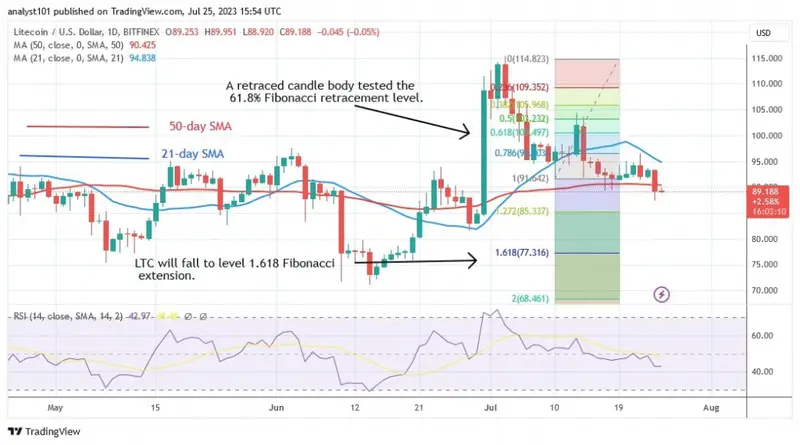
When the Litecoin price was stuck between the moving average lines, the bearish momentum slowed down for a week. Yesterday, the bears intensified the selling pressure on the market by breaking below the 50-day line SMA.
The price indication has previously suggested that the coin will decline. After the price decline on July 10, Litecoin reversed upwards and a retreating candlestick tested the 61.8% Fibonacci retracement line.
After the correction, the market will fall to the level of 1.618 Fibonacci extension or $77.31. Further upward movement is unlikely at the moment.
Litecoin indicators analysis
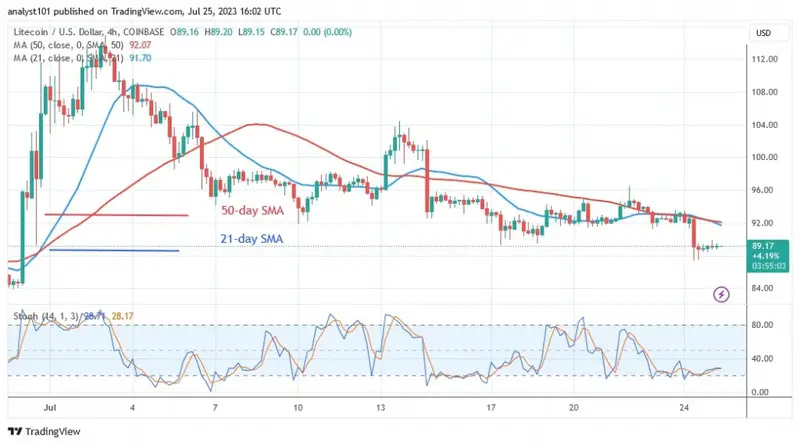
The recent slump has taken the cryptocurrency to the Relative Strength Index point 14 of level 42. As the price bars fall below the moving average lines, the selling pressure will increase. The altcoin is in a negative trend below the daily stochastic level of 40, and if the price breaks below the current support, the downward momentum could continue.
Technical Indicators
Resistance levels: $100, $120, $140
Support levels: $60, $40, $20

What is the next step for Litecoin?
After the price drop, Litecoin is consolidating above $87. The market is reaching oversold territory as the downturn continues. The price of the cryptocurrency is now slowly rising as there are doji candlesticks. Litecoin is nearing the end of its downtrend.

Disclaimer. This Analysis and forecast are the personal opinions of the author and are not a recommendation to buy or sell cryptocurrency and should not be viewed as an endorsement by CoinIdol.com. Readers should do their own research before investing in funds.
Comments
Post a Comment